Master the Psql Command Line: A Modern Developer's Guide
Unlock the full potential of PostgreSQL with this deep dive into the psql command line. Learn installation, advanced commands, and workflow automation.

In an age of slick graphical interfaces, it might seem strange that so many seasoned developers still swear by the psql command line for working with PostgreSQL. But the truth is, when you need raw power, speed, and scriptability, nothing beats it. If you're serious about managing PostgreSQL databases, getting comfortable with psql isn't just a nice-to-have skill—it's fundamental.
Why Psql Is Still the Pro's Choice
It's tempting to think of command-line tools as relics, but psql's enduring relevance comes down to pure efficiency. GUIs are great for visualizing data, but they often add a layer of abstraction that can slow you down. With psql, you're interacting directly with the database engine, giving you a level of control and immediacy that graphical tools just can't match.
The data backs this up. PostgreSQL has become a massive force in the developer community. The Stack Overflow Developer Survey 2024 shows that 51.9% of professional developers prefer it, putting it well ahead of MySQL at 39.4%. That popularity is built on the back of powerful tools like psql.
To give you a better sense of what makes psql so essential, here's a quick breakdown of its core strengths.
Psql At a Glance: Key Features and Benefits
| Feature | Description | Why It Matters |
|---|---|---|
| Direct Database Access | Bypasses intermediate layers, sending SQL commands straight to the engine. | This results in lower latency and faster execution, which is crucial for performance-sensitive tasks and quick debugging. |
| Meta-Commands | Built-in shortcuts (like \dt or \l) for schema inspection and admin tasks. | You can explore your database structure, check connections, and manage users without writing full SQL queries, drastically speeding up your workflow. |
| Scriptability | Easily integrates with shell scripts (bash, zsh, etc.) for automation. | Automate routine tasks like backups, data migrations, and reporting. A simple psql -c "..." command is all you need to get started. |
| Lightweight Footprint | Consumes minimal system resources (CPU and memory). | It's perfect for managing databases on remote servers via SSH or within resource-constrained environments like Docker containers. |
| Advanced Editing | Use your preferred command-line editor (like Vim or Emacs) for complex queries. | Write and edit multi-line SQL with the full power of a real text editor, then execute it directly in your psql session. |
These features combine to create a tool that is far more than just a query runner; it's a complete environment for database interaction.
Built for Speed and Precision
The main reason developers keep coming back to psql is the sheer speed of their own workflow. There's no waiting for a UI to load or navigating through menus to find the right option. Your commands are direct, the feedback is instant, and you can automate complex operations with simple scripts.
This direct connection delivers real performance. For example, recent benchmarks on Ubuntu 24.04 revealed that a standard psql connection could handle an incredible 21,338 single-row INSERTs per second, with a mean latency of just 2.39 milliseconds. That's the kind of high-throughput performance that modern applications demand. You can dig into the full database performance statistics on Linux if you're curious about the details.
Key Takeaway: The
psqlcommand line isn't a legacy tool; it's a high-performance interface that provides direct, scriptable access to the full power of PostgreSQL. It's built for developers who prioritize speed, automation, and control over visual interfaces.
Core Strengths for Everyday Tasks
The true value of psql really shines in the day-to-day grind. It excels in common scenarios where a GUI might feel clumsy or slow.
-
Scripting and Automation: Need to run a nightly data cleanup? Just wrap your SQL in a shell script using
psql -c "DELETE FROM event_logs WHERE created_at < NOW() - INTERVAL '30 days';". It's a simple, powerful way to automate almost any database task. -
Resource Efficiency:
psqlis a featherweight. It uses very little memory and CPU, which makes it the ideal choice when you're SSH'd into a remote server or working inside a Docker container. -
Interactive Exploration: This is where
psqlis a game-changer. You can quickly list all your tables with\dt, get detailed information about a specific table with\d+ my_table, or see all available databases with\l. This rapid feedback loop is a massive time-saver during development and debugging.
Whether you're just starting a new project with a managed service like Neon or managing a massive production cluster, psql is the universal language for PostgreSQL. This guide will walk you through the practical, real-world skills you need to make it an essential part of your developer toolkit.
Establishing Your First Psql Connection
Before you can do anything powerful with the psql command line, you first have to get it installed and connected to a database. The process is pretty straightforward, but the exact commands will change depending on your operating system. Once you're set up, you'll have an incredibly powerful tool for interacting directly with any PostgreSQL database.
Installing the Psql Client
First things first, you need the psql client on your machine. It’s typically included with the full PostgreSQL server installation, but you can usually install just the client tools if that's all you need.
- On macOS: The simplest method is using Homebrew. Just pop open your terminal and run
brew install libpq. This installs the client libraries, including thepsqlcommand. Homebrew is pretty helpful and will even tell you how to add it to yourPATH. - On Linux (Debian/Ubuntu): You can grab the client directly with
apt. Runsudo apt-get update && sudo apt-get install postgresql-client. - On Windows: These days, the best way to get a native Linux environment on Windows is with the Windows Subsystem for Linux (WSL). After setting up a distribution like Ubuntu, you can just follow the Linux instructions right from your WSL terminal.
Once it's installed, run psql --version in a new terminal window. If you see a version number, you're good to go.
Connecting to a Local Database
If you have a PostgreSQL server running on your own computer, connecting can be as easy as typing psql and hitting Enter. By default, psql tries to connect to a database that has the same name as your operating system user, using that same username.
For more specific connections, you can use flags to define the database and user. Say you have a database named mydatabase and a user myuser. You would connect like this:
psql -d mydatabase -U myuser
This tells psql to connect to the mydatabase database as the myuser user. If that user has a password, psql will prompt you to enter it securely.
Troubleshooting Tip: Ever seen the
FATAL: Peer authentication failed for user "your_user"error? This usually happens because PostgreSQL is trying to match your OS user with your database user. A quick way around this is to force password authentication by specifying the host:psql -h localhost -d mydatabase -U myuser.
Connecting to a Remote Database
In most real-world jobs, your database won't be on your laptop. You'll be connecting to a cloud database from a provider like Neon or Supabase, or to a server managed by your company. For this, you’ll need a bit more connection info, usually packaged as a connection URI.
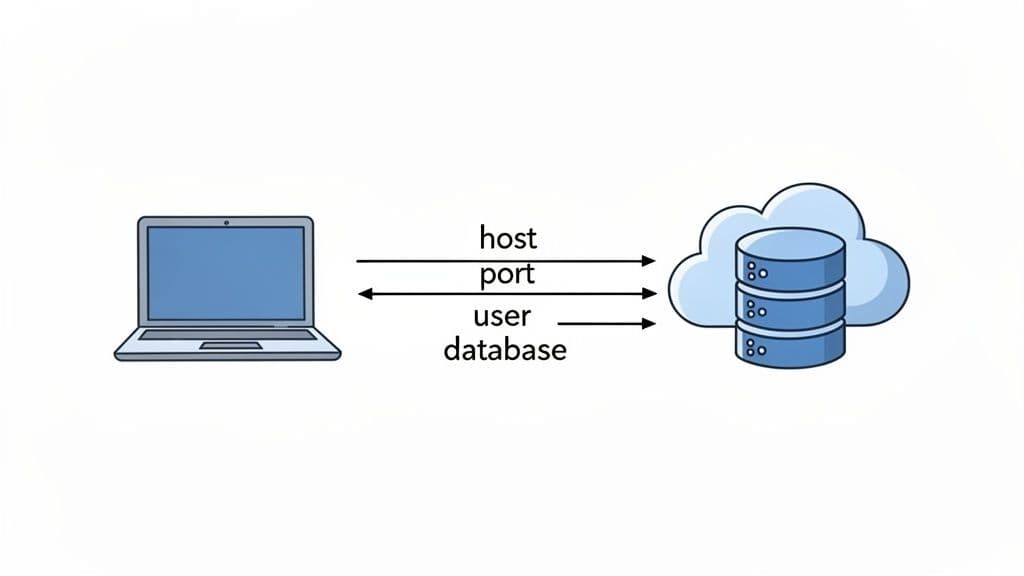
A connection URI (or "connection string") is just a single line of text that bundles all the connection details together. It follows a standard format:
postgresql://user:password@host:port/database
Here’s a quick breakdown of what each piece means:
user: The database role you're authenticating as.password: The password for that specific user.host: The server’s address, likedb.example.com.port: The port number the database listens on. For PostgreSQL, the default is 5432.database: The name of the database you want to access.
Most cloud database providers will give you this URI—all you have to do is copy and paste it.
For instance, if you get a URI like this:
postgresql://db_user:Abc123xyz@db.neon.tech:5432/my_project
You can connect directly by feeding it to psql:
psql "postgresql://db_user:Abc123xyz@db.neon.tech:5432/my_project"
I always recommend wrapping the URI in quotes. It prevents your shell from getting confused by special characters like @ or & that might be in your password. With that one command, you can open a secure session with any remote database right from your own psql command line.
If you want to go deeper on connection options, check out our guide on how to connect to a PostgreSQL database. Mastering this is the key to managing any PostgreSQL instance, anywhere in the world.
Navigating Your Database with Essential Meta-Commands
Once you're connected, you'll find the real magic of the psql command line isn't just in running SQL. It's in the meta-commands—special backslash-prefixed shortcuts that let you explore and manage your database without writing a single query.
Think of them as your personal toolkit for getting your bearings in any database, new or old. These commands are what turn psql from a simple query tool into a fully interactive environment. Let's skip the dry reference lists and jump right into how you’ll use these in your day-to-day work.
Exploring Your Database Environment
The first thing you’ll do after connecting is get a lay of the land. What databases are even on this server? Which one am I in? This is where meta-commands become second nature.
A typical workflow starts with listing all available databases and then hopping into the one you need.
- To see every database on the server, just type
\l(a shortcut for\list). You'll get a clean table with database names, owners, and encodings. - Once you've spotted your target, use
\c [database_name]to switch your session over to it.
For instance, you might run \l, see a database named analytics_prod, and immediately connect by typing \c analytics_prod. It's a quick two-step that you'll do without even thinking after a few sessions.
Inspecting Your Schema with Precision
Now that you're in the right database, you need to see what's inside. What tables, views, and functions make up the schema? This is where the \d family of commands comes in handy.
You can get a quick overview with these:
\dt: Lists all tables.\dv: Lists all views.\df: Lists all functions.\dn: Lists all schemas.
These are great for a quick glance. But the command I use dozens of time a day is \d+. By adding a + to the standard \d command, you unlock a much richer, more detailed view.
Let's say you're looking at a users table. Running \d users shows you the basic column names and data types. But \d+ users is the real deal—it gives you everything: column descriptions, storage info, constraints, indexes, and even which tables reference it.
-- This is a developer's best friend for deep-diving into a table's structure.
\d+ users
This command alone saves you from digging through documentation or fumbling with information_schema queries. All the critical details are right there, perfectly formatted.
Key Insight: I can't stress this enough: using
\d+is the single fastest way to get a complete picture of a table. It's my go-to for understanding legacy schemas or debugging issues related to constraints and indexes.
To help you get comfortable swapping out a GUI for the command line, this table maps some common database tasks to their psql meta-command counterparts. It's a great cheat sheet to keep handy as you build muscle memory.
Essential Psql Meta-Commands for Daily Workflows
| Task | Psql Meta-Command | Example Usage |
|---|---|---|
| List Databases | \l or \list | \l |
| Connect to a Database | \c [db_name] | \c my_app_db |
| List Tables | \dt | \dt |
| Describe a Table | \d [table_name] | \d orders |
| Describe a Table (Detailed) | \d+ [table_name] | \d+ orders |
| Edit Last Query | \e | \e |
| Measure Query Time | \timing | \timing |
Think of these commands as the foundation for a faster, more efficient workflow. They are the shortcuts that experienced developers use to navigate and understand databases quickly.
Improving Your Query Workflow
Beyond just exploring the schema, meta-commands can dramatically speed up the process of writing and analyzing your queries. Two in particular are absolute game-changers.
First up is \e. We've all been there—trying to write a long, complex query directly in the terminal is a recipe for frustration. Instead of fighting with your arrow keys, just type \e. This command pops open your system's default editor (like Vim or Nano) with your last-run query ready to go. You can edit it comfortably, save the file, and psql will immediately execute the updated version. It's a lifesaver.
Second, for anyone who cares about performance, there's \timing. Just type \timing to toggle a simple timer on or off. With the timer enabled, every query you run will now show you exactly how long it took to execute. This gives you instant feedback, making it incredibly easy to spot slow queries during development without having to wrap everything in EXPLAIN ANALYZE.
Uncovering Performance Insights Within Psql
While psql is fantastic for everyday tasks like browsing schemas and running queries, its real power shines when you need to dig into performance problems. You can get to the root of slow queries and I/O bottlenecks right from the command line, using hard data to tune your database instead of just guessing.
The basic workflow you've already learned—connecting, listing tables, and inspecting them—is the foundation for this kind of detective work.
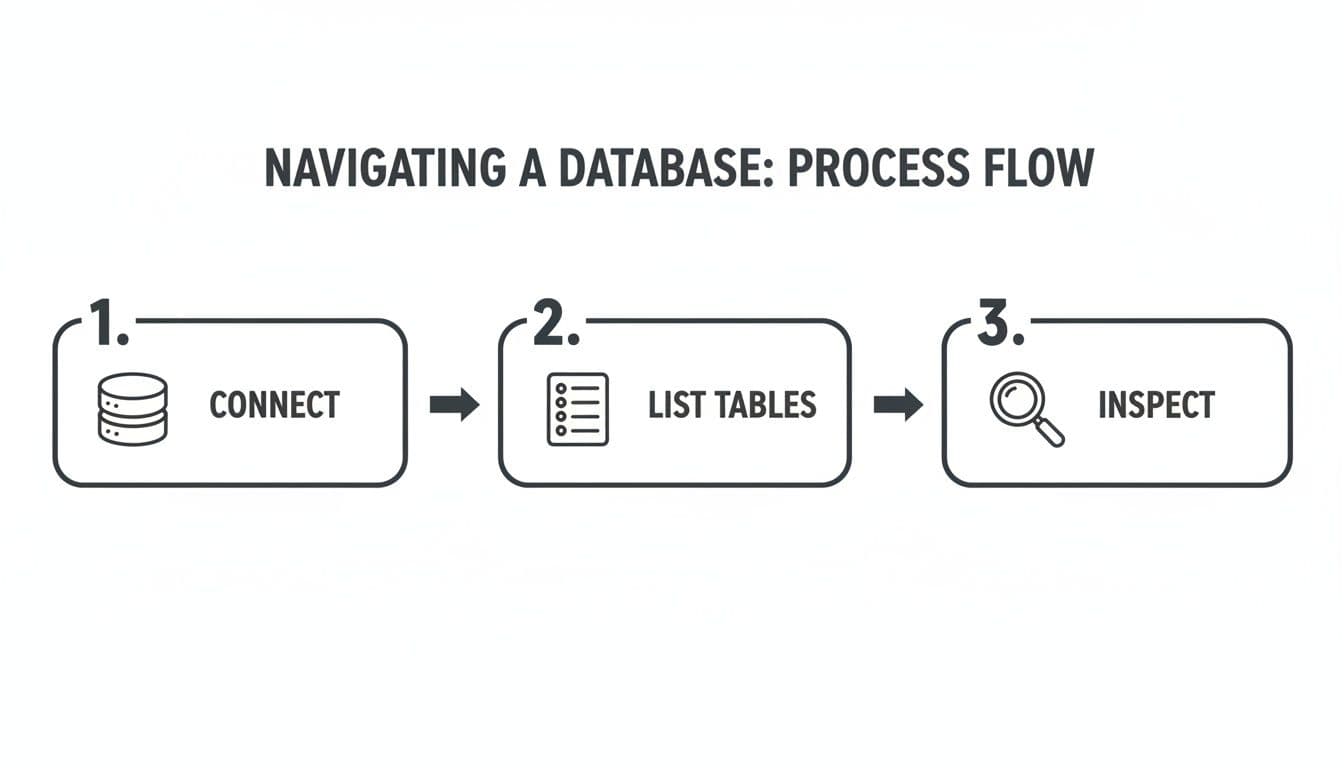
Now, let's build on that flow to start diagnosing performance.
Identifying Costly Queries with pg_stat_statements
One of the first places I always look is the pg_stat_statements extension. After you enable it, Postgres starts tracking execution stats for every query that runs. It's an absolute goldmine for finding out which queries are hogging all the resources.
For example, here’s a query I run all the time to find the top five heaviest hitters by total execution time:
SELECT
  (total_exec_time / 1000 / 60) AS total_minutes,
  (mean_exec_time)::numeric(10, 2) AS avg_ms,
  calls,
  query
FROM pg_stat_statements
ORDER BY total_exec_time DESC
LIMIT 5;
This gives you a quick, sorted list that shows you:
total_minutes: The total time your database has spent executing a query. This shows its overall impact.avg_ms: How long the query takes on average. Perfect for spotting consistently sluggish queries.calls: The number of times the query has been run.
Don't just look at the avg_ms. A query with a high total_minutes but a low avg_ms is a classic sign of death by a thousand cuts. A fast query that's called thousands of times can cause more trouble than a slow one that only runs occasionally. Making a tiny improvement to a frequently called query can lead to huge performance gains. For a deeper dive, you can explore other SQL query optimization techniques.
Pinpointing I/O Bottlenecks with pg_stat_io
Sometimes, a query isn't slow because it's CPU-bound; it's slow because it's waiting for the disk. This is where I/O analysis is crucial. Starting with PostgreSQL 16, the pg_stat_io view gives you an incredible byte-level look at I/O directly from psql.
This view lets you see exactly how much data is being read from disk (read_bytes) or written to it (write_bytes). When you combine this with pg_stat_activity, you can connect I/O pressure directly to a live query and user session.
Real-World Scenario: Let's say your app feels sluggish after a new reporting feature went live. You can join
pg_stat_iowithpg_stat_activityto see if a specific, active query is responsible for a massive number ofread_bytes. This is a dead giveaway that your query is causing the database to fetch way too much data from disk instead of serving it from memory.
Combining Views for a Complete Picture
The real magic happens when you start joining these statistics views together. You can link historical data from pg_stat_statements to what’s happening right now in pg_stat_activity.
Here's a practical query for finding active queries that you already know are historically expensive.
SELECT
  act.pid,
  act.usename,
  stm.mean_exec_time,
  stm.calls,
  act.query
FROM pg_stat_activity act
JOIN pg_stat_statements stm
  ON act.queryid = stm.queryid -- Use queryid for more reliable joining
WHERE act.state = 'active'
ORDER BY stm.mean_exec_time DESC;
When you run this, you get a list of live queries along with their historical rap sheet. If you spot an active query with a high mean_exec_time, you've likely found a performance bottleneck in the act. This turns psql from a simple interactive shell into a powerful, real-time diagnostic dashboard.
Automating Workflows with Psql Scripting
While the interactive psql command line is great for poking around and running one-off queries, the real magic happens when you start scripting. By weaving psql into your shell scripts, you can automate tedious tasks, keep your deployments consistent, and build some seriously powerful, repeatable database workflows. This is the leap from simply using psql to making it work for you.
The easiest way to get started is by running a single command straight from your shell with the -c flag. This is a lifesaver for quick checks or simple updates inside a larger script. For example, you can grab a user count without ever entering the interactive prompt.
psql -d myapp_db -c "SELECT count(*) FROM users;"
This command connects, runs the query, prints the result, and immediately exits. It's clean, fast, and perfect for embedding in automated health checks or deployment scripts.
Executing SQL Scripts from Files
For anything more complex than a one-liner, like running a database migration or loading a batch of data, the -c flag gets clumsy. This is where you'll want to run an entire SQL script from a file using the -f flag. It simply tells psql to read and execute all the commands from a file you point it to.
Let's say you have a file named setup_new_user.sql with a handful of INSERT and UPDATE statements. You can execute the whole thing with a single command:
psql -d myapp_db -f setup_new_user.sql
Now, here's a crucial tip for scripting: by default, if one command in your script fails, psql just shrugs and moves on to the next one. This is a recipe for disaster, potentially leaving your database in a partially updated, corrupted state. To avoid this, you can set a special variable that tells the script to stop dead in its tracks on the first error.
psql -v ON_ERROR_STOP=1 -d myapp_db -f setup_new_user.sql
Adding -v ON_ERROR_STOP=1 is a non-negotiable best practice. It makes your scripts far more reliable, ensuring that a single failed step brings the whole operation to a halt before any more damage can be done.
Creating Dynamic and Reusable Scripts
Hardcoding values like table names or user IDs directly into your scripts will create a maintenance nightmare down the road. Thankfully, psql has its own variable system you can use with the \set meta-command, which lets you build dynamic, reusable scripts. You can then pass values into these scripts from the command line using the -v flag.
Let's build a simple maintenance script, archive_logs.sql, to show how this works. The script will move old records based on a date we provide.
-- archive_logs.sql
DELETE FROM logs WHERE created_at < :'cutoff_date';
See the :'cutoff_date' syntax? That's the placeholder psql will replace with our variable. Now, from the shell, we can run the script and feed it a date dynamically.
psql -d myapp_db -f archive_logs.sql -v cutoff_date="'2024-01-01'"
This simple technique turns a static script into a flexible tool you can run from cron jobs or other automated tasks. For example, you could apply this same approach to data imports. If you find yourself working with CSVs, you might also find some helpful tips in our guide on how to import CSV files into PostgreSQL.
Customizing Your Psql Environment
To really make psql feel like your own, you can create a .psqlrc file in your home directory. This file is a configuration script that psql automatically runs every single time it starts, letting you set up your ideal environment without retyping the same commands over and over.
Here’s a practical .psqlrc file that includes a few of my favorite settings:
-- ~/.psqlrc

-- Always stop scripts on the first error
\set ON_ERROR_STOP on

-- Show how long each query takes to run
\timing

-- A more useful prompt showing user@database
\set PROMPT1 '%n@%/%R%# '

-- Set my favorite editor for the \e command
\set EDITOR 'vim'
Pro Tip: Your
.psqlrcfile is your personal command center. I use mine to define custom shortcuts for frequently run diagnostic queries. For example,\set top_queries 'SELECT query, calls, total_exec_time FROM pg_stat_statements ORDER BY total_exec_time DESC LIMIT 10;'. Now, I just type:top_queriesto see the most expensive queries.
This level of customization transforms the default psql client into a tool that's tailored to how you work. For reporting, you can even format query output as HTML using the \H command, which is perfect for generating automated email reports.
This capability also extends to performance analysis. Psql gives you direct access to PostgreSQL's statistics views. For example, a query against pg_stat_statements might reveal that an UPDATE on a 'tellers' table has been called 3,000 times with a total execution time of 8,015 ms and an impressive 99.97% cache hit rate. Uncovering metrics like these is invaluable for focusing your optimization efforts where they’ll have the most impact.
Once you start living in the psql command line, you'll inevitably hit a few common roadblocks. Here are some of the questions I see pop up all the time, along with the quick commands you'll need to solve them.
How Can I Export Query Results to a CSV File?
Getting data out of your database and into a CSV is a daily task for many of us, whether it's for a quick report or for analysis in another tool. The best way to do this directly from psql is with the \copy meta-command.
What's great about \copy is that it runs on your local client, not on the database server. This means you don't need any special superuser permissions on the server to write a file—it just saves it right to your own machine.
To dump the entire customers table to a CSV file, complete with a header row, you'd run this:
\copy (SELECT id, name, signup_date FROM customers WHERE is_active = true) TO 'active_customers.csv' WITH CSV HEADER;
That one command executes your query and streams the results straight into a file named active_customers.csv in whatever directory you're currently in.
What Is the Difference Between \d and \d+?
This is a classic. Both commands describe a table, but the level of detail they provide is worlds apart.
\d my_tablegives you the basics: column names, data types, and whether they can be null. It's perfect for a quick sanity check.\d+ my_tableis the deep-dive version. You get everything from\d, plus all the rich context—column descriptions, storage settings, constraints, indexes, and any foreign key relationships.
Actionable Insight: When debugging, always start with
\d+ your_table_name. It shows you constraints, triggers, and indexes at a glance. Seeing an unexpected index or a missing foreign key constraint can solve a problem in seconds.
How Do I Make Wide Query Output Easier to Read?
We've all been there. You run a SELECT * on a table with a dozen columns, and psql returns a jumbled mess of wrapped lines that's impossible to follow.
The fix is simple: just run \x to toggle expanded display mode.
This instantly reformats the output from a wide table into a clean, vertical key-value list for each row. It's a lifesaver for wide tables. When you're done, just run \x again to switch back to the standard view.
How Can I See Currently Running Queries?
When your database feels sluggish, the first thing you need to know is what's running right now. For that, you'll query the pg_stat_activity view. This is your go-to for finding long-running queries or identifying potential bottlenecks in real-time.
Here’s the query I keep handy for a quick look:
SELECT
  pid,
  now() - query_start AS duration,
  usename,
  query
FROM pg_stat_activity
WHERE state = 'active'
ORDER BY duration DESC;
This command shows you the process ID (pid), the user who ran the query, the full text of every active query, and most importantly, how long each query has been running. It's an indispensable diagnostic tool for finding stuck processes.
If you love the power of the command line but also want a modern GUI for exploring data, check out TableOne. It’s a clean, cross-platform app that connects to PostgreSQL, MySQL, and SQLite, letting you browse tables, edit data, and manage schemas without the fuss. Learn more at tableone.dev.